

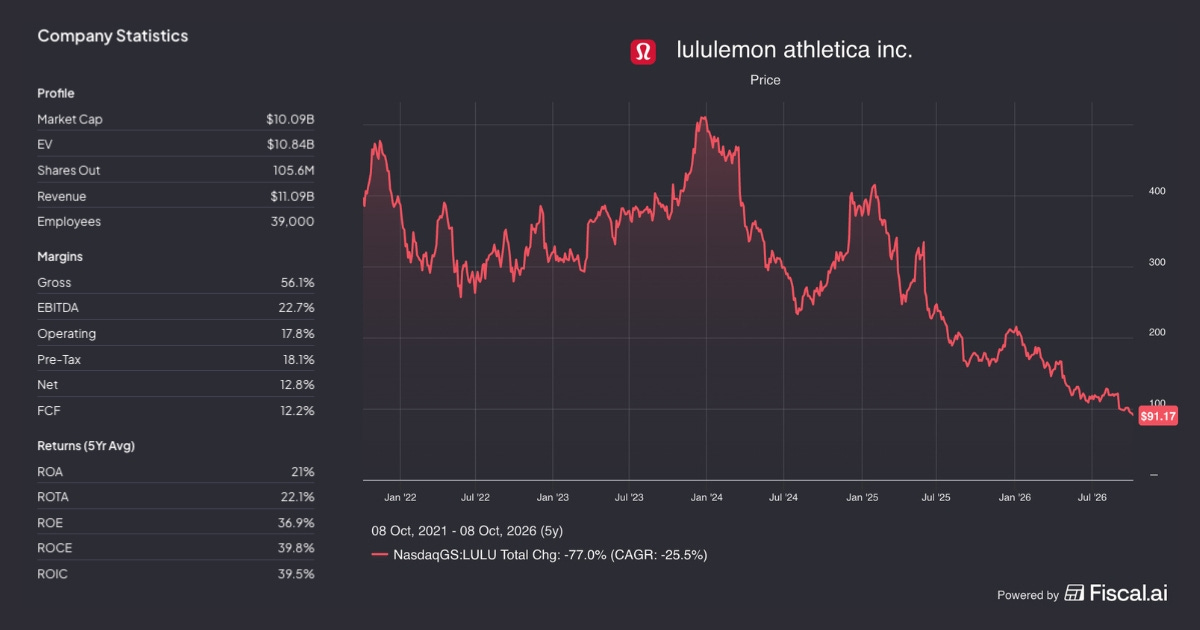
Lululemon has now fallen approximately 82% from its all-time high, wiping out roughly $55 billion in market capitalization.


Once considered one of the most successful premium consumer brands, the company now trades near its lowest share price in more than eight years.
An 82% decline does not automatically create an 82% opportunity.
Sometimes the market overreacts. Sometimes the business has genuinely changed.
Our job is to understand the difference.
Let’s dive in:
Lululemon Athletica — LULU 0.00%↑
0. Topics Covered
Why We Are Watching It
What It Does
What We Like
What Scares Us
Quality Score
Fair Value Range
Scenario Range
Buy Zone
Margin of Safety
Expected Value
QPOS Score + View
Final Takeaway
Let’s go.
1. Why We Are Watching It
We are watching lululemon athletica because:
the valuation has become interesting → the stock trades at approximately 10 times our estimated normalized earnings per share;
the business retains valuable qualities → Lululemon has a recognized premium brand, historically attractive returns on capital, and meaningful cash generation;
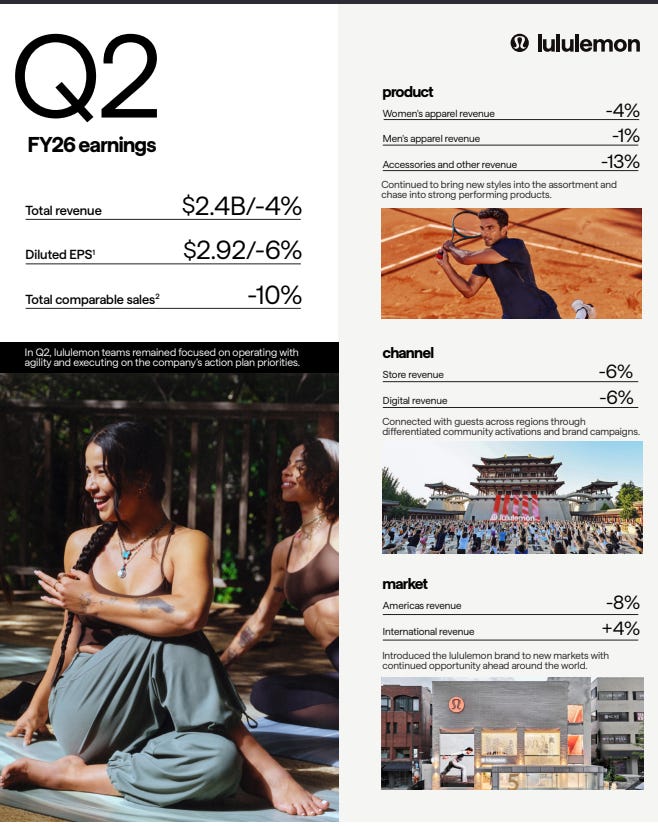
the market is questioning its durability → comparable sales fell 9% globally and 12% in the Americas in Q2 FY2026. This raises a fundamental question about pricing power and brand relevance.
Is the current weakness a temporary execution problem, or evidence that lululemon’s competitive advantage is structurally eroding?
That distinction determines whether the low valuation represents an opportunity or a value trap.
2. What It Does
Lululemon is a premium athletic apparel company selling technical clothing, footwear, and accessories for yoga, training, running, and everyday life.
It makes money through:
company-operated stores → direct sales of apparel and accessories;
e-commerce → digital sales through its own channels;
other channels → including selected wholesale and partner arrangements.
Customers pay a premium for perceived quality, fit, design, and brand identity.
The business depends on maintaining that premium perception.
Unlike a subscription business, its revenue is not contractually recurring. Customers must repeatedly choose lululemon over alternatives.
And switching costs are low.
This is why brand strength matters so much.
3. What We Like
The attractive parts:
Strong historical economics: Lululemon has historically generated high returns on invested capital. Its premium positioning and direct-to-consumer model have supported attractive profitability.
Real cash generation: the business remains cash-generative despite its operational challenges; however, the six-month figure is affected by seasonality and working capital therefore it should not be mechanically annualized.
Financial flexibility: Lululemon ended Q2 FY2026 with approximately $1.4 billion in cash and cash equivalents. That provides resources to invest in products, stores, marketing, and the business turnaround without immediate dependence on external financing.
International opportunities: international revenue increased 4% in Q2, despite an 8% decline in the Americas; the international business offers a potential growth runway, although current growth is not sufficient to offset domestic weakness.
4. What Scares Us
The risks:
Brand erosion: Lululemon operates in a competitive category where consumer preferences can change quickly; a premium brand is valuable only while customers continue to value the difference.
Weak comparable sales: global comparable sales declined 9% in Q2 FY2026, in the Americas 12%. That is more concerning than a temporary slowdown in store openings because it points toward weakness in the existing business.
Margin pressure: reported Q2 operating margin was 18.8%, but the quarter included $134.5 million of tariff refunds, contributing approximately 5.6 percentage points to the margin. Excluding that benefit, the operating margin was approximately 13.2%.
Turnaround execution: the company has new leadership and a business that needs stronger products, improved demand, and better execution. A turnaround can require more time and capital than expected. Buybacks may support earnings per share, but they cannot permanently compensate for a deteriorating operating business.
5. Quality Score
Business Quality — 3/5
Lululemon retains a strong premium brand and an established market position
Brand recognition, product differentiation, and customer loyalty remain competitive advantages
Switching costs are low, and demand is discretionary
Pricing power is under pressure as competition intensifies
Declining comparable sales raise concerns about the durability of its competitive advantage
Financial Quality — 4/5
Historically high returns on invested capital (ROIC) demonstrate strong capital efficiency
The business continues to generate meaningful cash flow despite operational challenges
H1 FY2026 operating cash flow reached $589 million, with approximately $312 million in free cash flow
A substantial cash position provides financial flexibility
Underlying operating margins have weakened, raising questions about earnings sustainability
Management / Capital Allocation Quality — 2/5
Share repurchases have reduced the total share count
Approximately $695 million was spent on buybacks in H1 FY2026.
Capital allocation effectiveness depends on the prices paid relative to intrinsic value
Returns on reinvested capital remain uncertain
New leadership has yet to demonstrate consistent capital allocation discipline
Total Score
9/15
6. Fair Value Range
Our fair value range:
